Today the internet has great importance in interchanging the information. To make it possible, you need web services. The better web services you have, the better your application will perform.
Jump to Section
Web Services
Web Services is basically a technology, it helps applications to communicate with each other in a platform-independent manner.
Protocols are used to describe the web services, and these protocols are based on XML, and some standardized XML messages are used by web service for communication with other services.
WSDL
Web services are generally described using Web Services Description Language (WSDL). The WSDL comprises of the URL for the web benefit, the strategies that are open, the information parameter sorts and the arrival sorts of the web benefit.
SOAP
Standard Object Access Protocol (SOAP) is used as the messaging standard for communicating with the web service. The message is wrapped in a SOAP Envelope, which can be delivered across the network over most known transport protocols like HTTP, IIOP, and SMTP and so on.
UDDI
Web services are published and located with the help of Universal Description, Discovery, and Integration (UDDI).
Testing the Service
You must perform different levels of testing to test the web services. These are:
Proof of Concept Testing
As per my opinion, this is the most important part of web services testing. The concept of web services is new so, first we must ensure, that whatever the architecture we are selecting for the application is correct. For selecting the correct architecture, we should verify some points before developing the web services e.g. which programming language should be used to develop the web services, the database for the application etc.
Proof of Concept Testing helps in knowing the accuracy of the architecture and also if the system is designed correctly or not.
Functional Testing
You should run this in order to ensure that the web service is functionally correct. It has the ability to handle the exceptions and the boundary value conditions. It involves, carrying out some set of tasks automatically and comparing the result of the same with the expected output, and ability to repeat the same set of tasks multiple times with different data input and the same level of accuracy.
Regression Testing
Whenever there is a change in the existing requirement, an addition of new functionality after the release of the system, then we need to change the existing system. In this case, some functionality may be lost or modified. In order to ensure that the web service is still working fine, we need to perform regression testing. Previously written test cases are used for regression testing, and these test cases act as a benchmark which every release must pass.
Load Testing
Here we test the performance of web services. We check the condition when multiple users are going to access the system simultaneously. In terms of performance, we test the consistency of web services i.e. the performance of web service should not degrade while handling multiple users load.
We have many automated tools available for load testing, I personally recommend JMeter which is a free and open source tool. Let’s have a basic understanding, how to perform load testing with JMeter.
What is JMeter?
Apache JMeter is a Java-based, open source application to perform load testing. It is a Java-based application, which you can run it on any operating system.
The Prerequisites
First of all, you need to fulfill some requirements before start working on JMeter. These are:
| Software and Hardware | Minimum | Recommended |
| JDK | JDK 1.6 and above | JDK 1.6 and above |
| RAM | Not Specific | 4 GB |
| Processor | Not Specific | Processors with Minimum 4 MB Cache |
| Memory | Not Specific | 80 GB |
| Operating System | Windows, Linux and Mac | Windows, Linux and Mac |
| JMeter | Any Version | JMeter 2.11 |
How to Install and Run JMeter?
Steps:
1. You need to download and install the latest JDK on your system as JMeter is a java based application so it requires JDK.
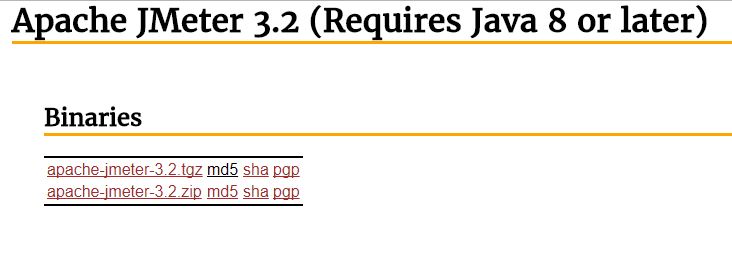
2. Then you need to download Apache JMeter Binaries. After download, you can save it to your desired location.
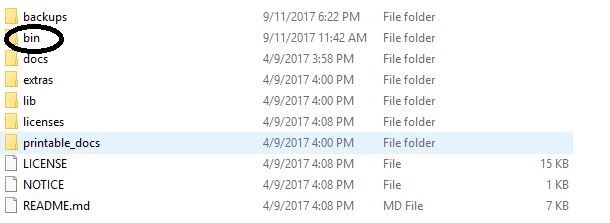
 3. You need to extract the zip file after download. You need to go to the bin folder in the extracted folder.
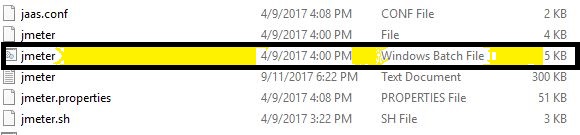
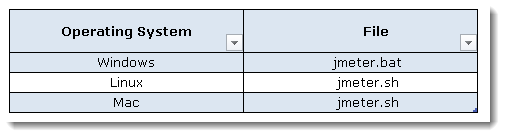
4. Inside this bin folder, you will find a file named as jmeter.bat. You can run this file by double-clicking on it.
Start a Basic Test Plan in JMeter
Steps to run a basic test plan in JMeter :
1. When you run the jmeter.bat file, it will open a window like this.
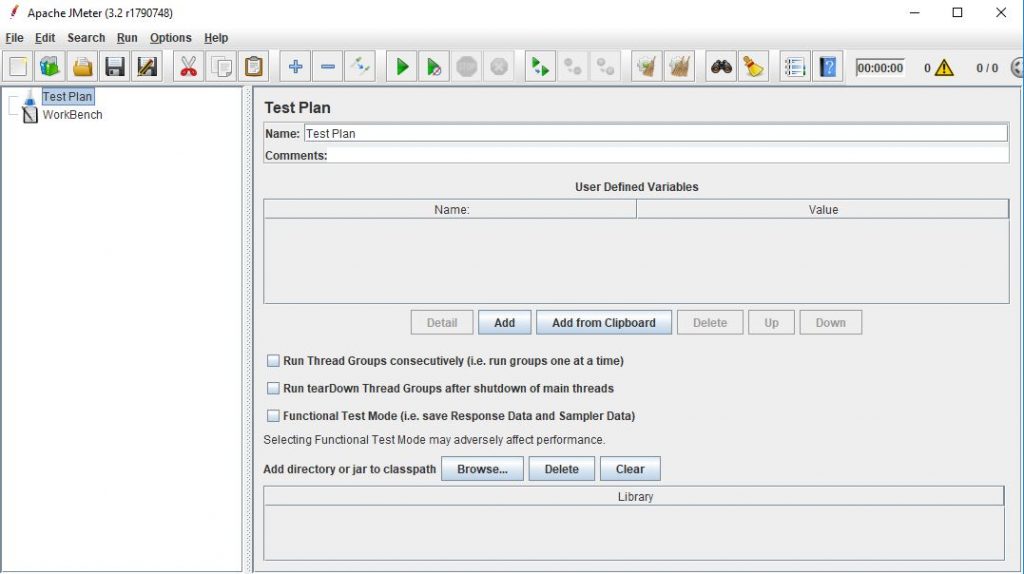
You can see two options on the left-hand side in it – Test Plan and Workbench.
– Test plan: We keep our real test plan here.
– Workbench: We use it as a temporary storage, where test elements store when they are not in use. When we save our test plan workbench items are not saved with it.
How to Create a Test Plan?
Right-click on Test Plan>>Go to Threads (Users)>> Thread Group>>Click on Thread Group.
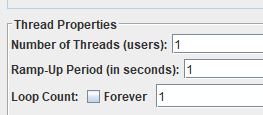
After you follow the above-mentioned steps, this window will appear. You need to define three properties in thread properties section.
Number of Threads (users): Number of virtual users you want to create.
Ramp-Up Period: After how much time a user will hit the desired service.
Loop Count: How many numbers of time you want to execute the same.
2. Add HTTP Request Default
Right click on Test Plan>>Go to Sampler>> HTTP Request >>Click on it.
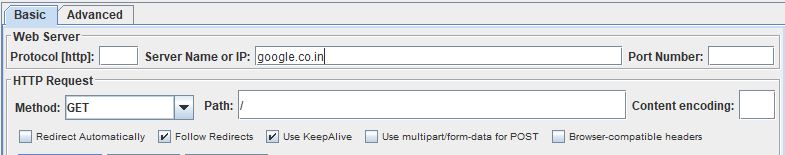
You need to pass the IP address or URL of the web application in Server Name or IP.
If you want to change it to https then mention it in protocol section because by default, it will take HTTP protocol.
If you want to hit an inner page of a web application, then you need to pass it in path section like /about-us.
3. Add a View Result in Table Listener
Right-click on Test Plan>>Go to Listner>>View Result in Table >>Click on it.
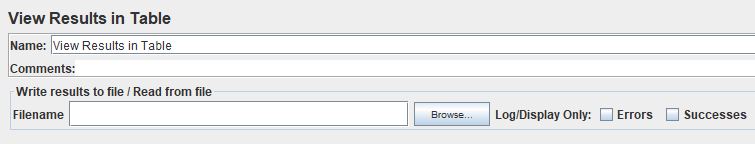 If you want to write your result in a file like .csv, .txt then you need to pass the file-path in the filename section.
4. As per my personal opinion, Before you run your test plan save it first, click on file, then click on save test plan as, and save it to your desired location.
5. Run Test Plan
Now, you can run your test plan by clicking on the green color play button, and finally, you will get the result summary for the test plan.
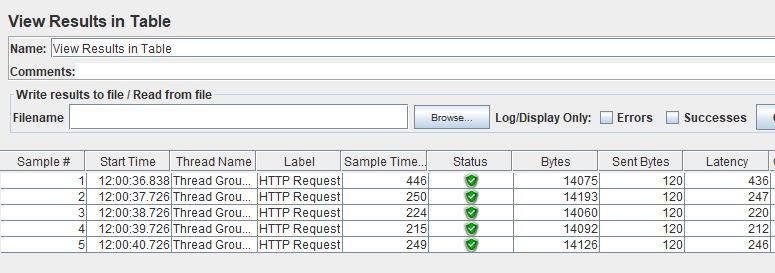
You can see a green color icon in status section, it indicates that the test plan has passed.
Sample Time: You can analyze the time in milliseconds took by the server to serve the request in this section.
Latency: In this, we can see the time in milliseconds when JMeter sent the request and received the response.
Bytes: It means, the sample data given by the server in terms of response.
- COVID-19: How We Are Dealing With It as a Company - March 23, 2020
- Agile Testing – The Only Way to Develop Quality Software - February 8, 2019
- How to Perform System Testing Using Various Types Techniques - May 16, 2018
Great Work Vikas..Keep it up!
Thanks Bimmy
very detailed…well written!
Thanks Rohan
Great work Vikas.. Well Written!
Thank you very much
Nicely explained… Great Job Vikas.
Great Job… Keep it up Vikas.
Thanks for the Valuable Information Sir… 🙂
very well described!!
Very helpful for learning j meter…
Very informative post…..Great Job Sir…